
WISE Metrics
The “WISE triangle” below shows dozens of Beyond-GDP metrics which have been proposed in the past decades. Only measurement systems that have been proposed at the national level have been included (not city, regional, business or investment metrics). By clicking on one of the circles you can see further information about each Beyond-GDP metric.
The WISE triangle has the following conceptual foundation:
WISE = Wellbeing, Inclusion and Sustainability
The three corners of the triangle distinguish three dimensions of Beyond-GDP:
- Wellbeing relates to today’s wellbeing
- Inclusion relates to the distribution of wellbeing, both within countries and between countries
- Sustainability relates to the wellbeing of the future
These dimensions are based on the Brundtland and the Stiglitz/Sen/Fitoussi reports.
Beyond-GDP metrics are plotted in the WISE triangle according to the dimensions they cover. The metrics in the corners cover only wellbeing (yellow), Inclusion (pink) or sustainability (blue). The orange, green and purple areas show metrics that cover two dimensions and the middle triangle covers all three.
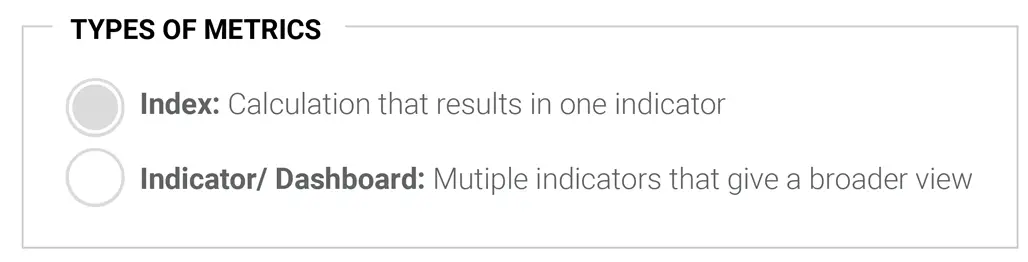
Index vs. Indicator Dashboard for Measuring Beyond-GDP
Beyond-GDP measurement systems take one of two approaches:
- An Index provides one summary number. For example, the Human Development Index (HDI) aggregates the performance of a country on education, health, and income into one number and is often used by the UN and researchers. Since the index presents only one value, it does not allow the reader to immediately see how education, health or income each change over time.
- A Dashboards of Indicators presents the performance of a country in a set of indicators without aggregating them into one number. This is done to respect the fact that progress is multidimensional and should be measured in separate measures. It is argued that these dimensions cannot be aggregated in a single unit, such as money. Dashboards often have indicators for topics such as education, social connections, heath, income inequality, gender disparities, carbon dioxide emissions, material use or biodiversity loss. A famous example of a dashboard is the Sustainable Development Goals (SDGs) which has dozens of indicator/targets which the world should achieve by 2030.
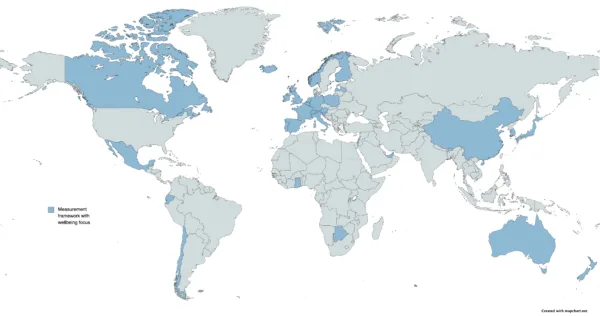
Country Initiatives
Over the last decades, an increasing number of government (agencies) have started to measure the development of wellbeing or sustainable development at the country-level. The figure and table below include a selection of these national Beyond-GDP initiatives. In addition to these initiatives, many countries measure progress towards the Sustainable Development Goals. This is often presented in so-called 'Voluntary National Reviews'. Do you have any suggestions for the overview? Please contact us.
| Country | Metric | Type | Description |
| Australia | Measure of Australia's Progress (MAP) | Dashboard | The Measure of Australia's Progress is a report published by the Australian Bureau of Statistics. It covers 26 indicators in four dimensions (Society, Australian Bureau Economy, Environment, Governance) measuring progress in Australia since 2002. The latest publication of the report was in 2013. Currently, Australia does not have a nationally agreed set of indicators to measure wellbeing. In 2023, the Australian Government will release a new ‘Measuring What Matters Statement’. It is expected to present a framework unique to the Australian context for measuring what matters to, and for, Australians, to provide a high-level view of Australia’s progress and well-being (Treasury 2022). |
| Austria | Austria.Data.Figures.Facts | Dashboard | Statistics Austria publishes an annual report on 30 key indicators categorized into three dimensions: material wealth, quality of life and environmental sustainability. An interactive tool allowing exploration of historical trends and comparison across indicators was also developed. Since 2021, Austria also conducts the survey "How we are today", together with 9 other EU countries. Every three months, changes in living conditions, income and wellbeing of private households in the European Union are recorded. |
| Belgium | Complementary indicators to GDP/Sustainable Development Indicators Belgium | Dashboard | Complementary indicators to GDP is a Belgian initiative to publish an annual report aimed at measuring people’s well-being and societal development at the federal level. The report has been published in 2016 and 2017, and details trends for 67 indicators grouped in 13 themes covering three conceptual dimensions: current generation (here and now), future generation (later) and other countries (somewhere else). From 2022 onwards, the report is called Sustainable Development Indicators. |
| Botswana | Botswana Vision 2036 | Dashboard | Vision 2036 is an agenda that defines Botswana's aspirations and goals as a people. In order to achieve prosperity for all there are four key priorities pillars: Sustainable Economic Development, Human and Social Development, Sustainable Environment Governance, and Peace and Security. There are 24 related indicators identified for which targets are set for 2026. |
| Bhutan | Gross National Happiness | Index | The Gross National Happiness (GNH) Index has been developed by the Centre for Bhutan Studies. The Index is constructed using a robust multidimensional methodology known as the Alkire-Foster method. The concept of GNH has often been explained by its four pillars: good governance, sustainable socio-economic development, cultural preservation, and environmental conservation. The four pillars have been further classified into nine domains which are all equally weighted. Within each domain, two to four indicators were selected that seemed likely to remain informative across time, had high response rates, and were relatively uncorrelated. Within each domain, the objective indicators are given higher weights while the subjective and self-reported indicators are assigned far lighter weights. |
| Canada | Quality of Life Framework | Dashboard | Canada’s Quality of Life Framework brings data together on key indicators across five broad domains (prosperity, society, health, environment, and good governance), including three central indicators (life satisfaction, sense of meaning and purpose, and future outlook). It also includes two lenses which are applied across all of its domains: the fairness and inclusion lens and the sustainability and resilience lens. The Framework provides important data that is used by governments, academics and civil society to understand and improve the state of equitable and sustainable well-being in Canada. |
| Canada | Canadian Index of Wellbeing (CIW) | Index | The Canadian Index of Wellbeing (CIW) tracks changes in eight quality of life categories or domains: community vitality, democratic engagement, education, environment, healthy populations, leisure and culture, living standards, and time use. The domains were determined in a co-creation process. The first report was published in 2012. |
| China | Annual Evaluations of the Ecological Progress | Dashboard | China started annual evaluations of ecological progress made by provincial, city and country governments since 2017. The evaluations are based on green growth targets, including resource utilisation, environmental quality and public satisfactions. |
| China | 14th Five-Year Plan | Dashboard | The 14th Five-Year Plan (2021-2025) is the overall road map for society, economy and environment. The Plan highlights high-quality, green development. The Plan has 20 quantitative targets, 8 of them binding, under five categories: economic development, innovation, people’s well-being, green development, and food and energy security. Seven targets focus on people’s well-being. |
| Denmark | Danish Sustainability Indicators | Dashboard | Statistics Denmark and the 2030-Panel publish 197 Danish indicators to translate the 17 UN Global Goals into a Danish context. The indicators are based on input from more than 6,000 Danish companies, organisations, researchers and dedicated citizens. |
| Ecuador | Buen Vivir | Dashboard | The Ecuador Statistics Office (INEC) compiled a set of indicators to monitor progress in line with the Buen Vivir concept, which stands for internal harmony, harmony within and among communities and harmony with nature. Buen Vivir is composed of three components, each based on different units of analysis: people, communities and nature. The selection of 7 dimensions and over 35 objective and subjective indicators is based on the various rights recognized by the Constitution, international experiences of life quality measurement (including the OECD Guidelines on Measuring Subjective Well-being), as well as national literature on the more subjective and spiritual facets of Buen Vivir. |
| Finland | Findicator | Dashboard | Launched in 2009 by Finland’s Prime Minister's Office and Statistics Finland, the Findicator (Findikaattori) is an online compendium of over 100 indicators on social progress, with a specific well-being category. The well-being indicators include 23 indicators across eight dimensions. Findicator will not be updated anymore as of 2022. A significant reason for discontinuing the maintenance of the Findicator service is that over the years the technology behind the service has become outdated. In February 2021, the Ministry of Social Affairs and Health appointed a steering group on the economy of well-being. Its task is to prepare a national action plan to integrate the economy of well-being approach into knowledge-based decision-making. |
| France | New Indicators of Wealth | Dashboard | In April 2015, the French Senate and the Parliament passed a law introducing the New Indicators of Wealth. The law requires, at the same time as the draft budget bill, the publication of an annual report using alternative indicators to GDP, with a view to modifying the statistical framework within which national economic policies are made. The dashboard considers 10 topics and 15 underlying indicators related to the economic, social and environmental domain. |
| Germany | Government Report on Wellbeing in Germany | Dashboard | The Government Report on Wellbeing in Germany describes wellbeing by means of 12 dimensions and 46 indicators. The dimensions and indicators were selected based on the results of a six-month national dialogue with citizens. The indicators will be updated on a regular basis and are tagged accordingly (last update: March 2020). |
| Ghana | 2030 Agenda for Sustainable Development | Dashboard | Ghana’s Agenda 2030 is built upon four pillars: Economic, Social, Environmental, and Institutional. The government has instituted an effective implementation coordination arrangement based on the decentralised planning system. Ghana also developed a tracking tool within the national budgeting process to monitor allocations and expenditure on sustainable development-related activities. |
| Iceland | Indicators for Measuring Well-being | Dashboard | Iceland introduced a framework of 39 well-being indicators in 2019. The indicators are grouped into three domains: society, environment and the economy. The process of developing and securing consensus on the wellbeing indicators involved various stakeholders, including the public, political opposition, public service, and spanned two years. The outcomes of the process are six wellbeing priorities, mental health, secure housing, better work-life balance, zero carbon emissions, innovation growth and better communication with the public, which will guide the country’s Five Year Fiscal Strategic Plan. While the framework and priority list have been approved by the Government, they could be improved upon as collaboration with stakeholders continues. |
| Ireland | Initial Well-being Dashboard of Indicators | Dashboard | The dashboard measures life and progress in Ireland through a cohesive set of indicators. The indicators relate to subjective well-being, mental and physical health, income and wealth, knowledge and skills, housing and local area, environment, safety, work and job quality, time se, community and social connections, civic engagement and cultural expression. The dashboard provides information on trends or direction over time across these indicators and benchmarks Ireland’s position against the EU as a whole. Inequalities are drawn out through examining distributions, differences between groups of people and deprivations. |
| Israel | Well-being, Sustainability and National Resilience Indicators | Dashboard | Well-being Sustainability and National Resilience Indicators is an annual report by the Israelian Central Bureau of Statistics which publishes a set of wellbeing, sustainability, and national resilience indicators. It includes indicators on the following domains: quality of employment; personal security; health; housing and infrastructure; education; higher education and skills; personal and social wellbeing; environment; civic engagement and governance; and material standard of living. In addition, the resolution required the development of two additional domains: information technology; and leisure, culture, and community. For each domain 8 indicators were selected. |
| Italy | Measures of equitable and sustainable well-being (Bes) | Dashboard | The project to measure Equitable and Sustainable Well-Being (Bes) aims at evaluating the progress of society from an economic, social, and environmental point of view. The National Institute of Statistics (ISTAT) in Italy publishes an annual Bes report from since 2013, covering 12 domains and 153 indicators. Since 2017, a subset of 12 indicators from the framework has become part of the economic planning cycle. |
| Luxembourg | Luxembourg Index of Well-being | Dashboard | The Luxembourg Index of Well-Being (“PIBien-être”) was developed through a collaboration between the National Statistics and Economic Studies Institute (Statec), the Economic and Social Council, and the Higher Council for Sustainable Development. It reports on 63 indicators, grouped under 11 domains of life, which closely correspond to the domains of the OECD framework for measuring wellbeing. In an additional step, these indicators are also summarised through a synthetic index. |
| Korea | Quality of Life Indicators in Korea | Dashboard | Quality of Life Indicators in Korea have first been presented in 2011. In 2018, the indicator systems has been revised. Quality of Life is measured by 71 indicators related to 11 domains. The annual report is used to identify strengths and weaknesses of the Korean society and to address domain-specific issues for a better quality of life. Since 2022, Korea also publishes a report on Children and Youth Wellbeing. |
| The Netherlands | Monitor of Well-being The Netherlands | Dashboard | The Monitor of Well-being from The Netherlands has been published since 2018 and is used to hold the government to account every year on Accountability Day in May on the basis of not only economic growth in terms of GDP, but also in terms of a broad concept of well-being. The first Monitor of Well-being included over 100 indicators on quality of life here and now, and how this affects the well-being of future generations and that of people living elsewhere. Since 2019, the SDG indicators have been incorporated into this monitor, as there is a lot of overlap between the well-being indicators CBS was using and the global SDG indicators. So every year in May the Dutch government is now held to account partly on how it performs on in terms of well-being and SDG’s. |
| New Zealand | Living Standards Framework (LSF) Dashboard | Dashboard | The LSF Dashboard provides the indicators that the Treasury believes are most important to inform their wellbeing reporting and policy advice on cross-government well-being priorities. For example, it informs their long-term stewardship publications such as the four-yearly Wellbeing Report required by the Public Finance Act. Analysis of the indicators from the LSF Dashboard was also used, alongside other wellbeing evidence, to inform development of the five priorities of the Government’s 2019 Wellbeing Budget. |
| New Zealand | Ngā Tūtohu Aotearoa – Indicators Aotearoa New Zealand | Dashboard | Indicators Aotearoa New Zealand is being developed by Stats NZ as a source of measures for New Zealand’s wellbeing. The set of indicators goes beyond economic measures to include well-being and sustainable development. It distinguishes three conceptual dimensions of sustainable development: current well-being, future well-being and the well-being of people living in other countries. In addition, contextual indicators are included. While these contextual indicators are not directly indicators of Aotearoa New Zealand’s well-being, they are included to assist with interpreting the indicators. |
| Rwanda | Rwanda Vision 2050 | Dashboard | Vision 2050 is a framework for Rwanda’s development, presenting the key priorities and providing Rwandans with a guiding tool for the future. There are five priority pillars: Human Development, Competitiveness and Integration, Agriculture for Wealth Creation, Urbanization and Agglomeration, and Accountable and Capable State Institutions. There are 46 underlying indicators for which targets are set for 2035 and 2050. |
| Scotland | National Performance Framework | Dashboard | The National Performance Framework (NPF) of Scotland was first published as part of the 2007 Spending Review, providing a 10 year vision for Scotland and using an outcomes-based approach to measure national and societal well-being. The NPF aims to get everyone in Scotland to work together to achieve 11 National Outcomes. Progress is measured by 81 National Indicators. The National Outcomes are included in the Community Empowermant Act, which requires Scottisch Ministers to set National Outcomes, consult on them, and review them every five years. |
| Slovenia | Indicators of Well-being in Slovenia | Dashboard | Indicators of Well-being have been developed as part of the National Development Strategy launched by the Slovenian government. The indicators are presented in three categories: Material, Social and Environmental well-being. The indicator set is implemented by a consortium of four institutions: the Institute of Macroeconomic Analysis and Development (IMAD), the Statistical Office of the Republic of Slovenia (SURS), the Slovenian Environment Agency (ARSO) and the National Institute of Public Health (NIJZ). |
| United Arab Emirates | National Programme for Happiness and Wellbeing | Policy instrument | The National Programme for Happiness and Wellbeing sets government policies, programmes and services that can promote virtues of positive lifestyle in the community and a plan for the development of a happiness index to measure people's satisfaction. The programme covers three domains: (i) inclusion of happiness in the policies, programmes and services of all government bodies and at work, (i) promotion of wellbeing and happiness as a lifestyle in the community (ii) development of benchmarks and tools to measure happiness. |
| United Kingdom | Measuring National Wellbeing programme | Dashboard | The Measuring National Well-being (MNW) programme from the UK started in 2010. It includes a dashboard on 10 areas of life, bringing together the latest data on how people in the UK are doing as individuals, communities, and a nation. It also considers how sustainable our well-being is for the future. A progress report is published biannually covering areas including health, natural environment, personal finances and crime. The measures include objective and subjective data. |
| Wales | Well-being of Wales | Dashboard | The Well-being of Wales is an annual report that helps to assess whether Wales is making progress against the 7 national well-being goals. These goals have been institutionalised via the Future Generations Act (2015) with the aim to incorporate social, economic, environmental and cultural well-being into the considerations of public bodies in Wales. Related to the seven goals, 50 indicators were selected to monitor progress on well-being. |